


Stuck in Neutral
Often as investors, we are forced to endure prolonged periods where it feels like our investments are stuck in neutral. These stretches of time can test our patience and resolve every bit as much as when markets are plummeting. The natural instinct is to believe that something must be broken, so we are tempted to shake things up a bit.
A headline on CNBC yesterday morning read, “The Stock Market is Exactly Where it Was One Year Ago”. If you do not track the market regularly, you may be thinking this is impossible. Every few weeks, we seem to read headlines that state that we have hit all-time market highs. What is missing from those headlines, however, is when was that last high…and what happened in between?
In the past decade, the technology heavy NASDAQ index has produced incredible returns, annualizing over 15% since the beginning of 2010. What is missed in that comment, however, is that over half of that stretch was still recovering from its 2000 – 2002 downturn.
On March 9, 2000, the NASDAQ index reached an all-time high of 5,046.86. This immediately preceeded the dot-com crash, which lasted until 2002. It finally reached a new all-time high on April 23, 2015! No, that is not a typo. Over 15 years later, the index finally eclipsed its all-time peak.
Global markets have been all over the place over the last 18-20 months, with multiple double-digit declines and recoveries. Those recoveries have resulted in periodic new highs, which have been followed by abrupt, sharp drops from those highs.
Last summer, we, in conjunction with BAM’s Director of Investment Research, commented that:
“there are a few things we can say, but that does not necessarily mean they are absolute. Relatively speaking, in a trade war, the US tends to do better because trade is a much smaller percentage of our GNP than it is for most countries. Small stocks also tend to do better because they tend to be less exposed to world trade. And the dollar tends to strengthen due to flight to safety and liquidity.
Conversely, international stocks tend to perform worse, and emerging markets the worst of all because their economies (a) tend to be more reliant on globe trade, (b) their currencies take a hit from flight to safety, and (c) their debt tends to be in dollars (which are appreciating).
If the president’s strategy of confronting our partners works, and tariffs around the globe ultimately come down, it will be a huge win for the entire world, not just the US. In that case, stock prices would likely rebound sharply, while bond yields likely would rise. International stocks would likely do better than the US, and emerging markets would recover the most. Of course, that is an all else equal kind of thing and all else is never equal.
On the other hand, if it turns into an all-out war and tariffs remain in place for the foreseeable future, it would likely lead to lower economic growth around the world, with the US least impacted. That would likely forestall any further Fed rate hikes as they become concerned about growth.”
Unfortunately, the trade war has continued to drag-on, and much of what was written above has come to fruition. Each time it appears a deal is in the works, markets have celebrated that progress. Conversely, each time negotiations fall apart and the US or China retaliates, markets have pulled back.
Markets hate uncertainty even more than they dislike a certain, negative event, so until there is some clarity around these trade negotiations (and to a different degree, Brexit), we continue to bounce around on a sideways trajectory for the time being. While this feels like we are stuck in neutral and lacking progress, it is actually quite normal in the grand scheme of things.
A colleague recently wrote a terrific blog titled Watching Paint Dry. In this article, Blair DuQuesnay takes a dive into market stats from the last 90 years and finds that roughly 25% of the time, we (as investors) should expect markets to be flat over any random 18-month stretch of time. As such, what we currently experienced is not abnormal, nor is your mind playing tricks on you. Headlines and recent momentum can be very deceiving to investors.
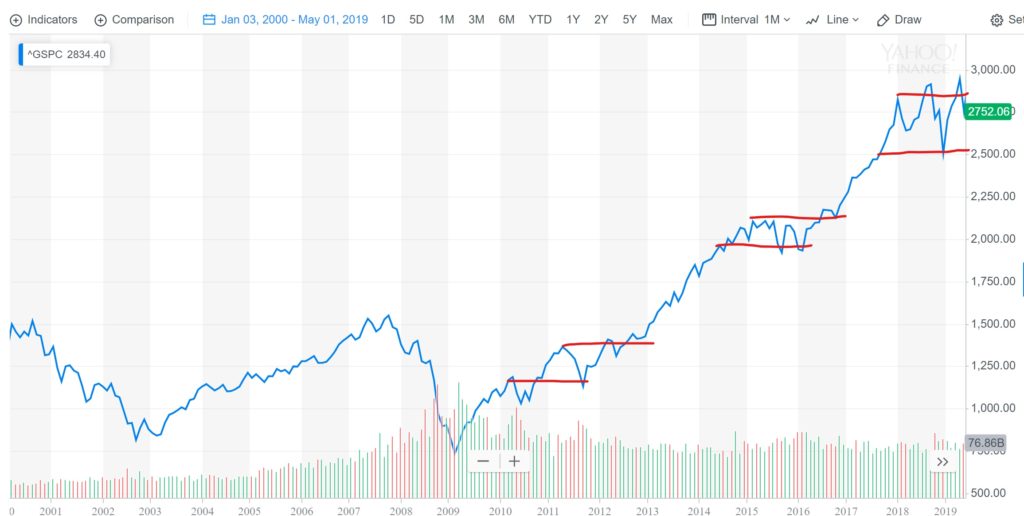
Referring to the S&P 500 chart below, you can pretty clearly see many instances where this has been the case, even during the last decade’s raging bull market.
The table below highlights the performance of the major asset classes you may find in your portfolios since January of 2010. In summary, large US stocks have handily outperformed every other asset class for this decade.
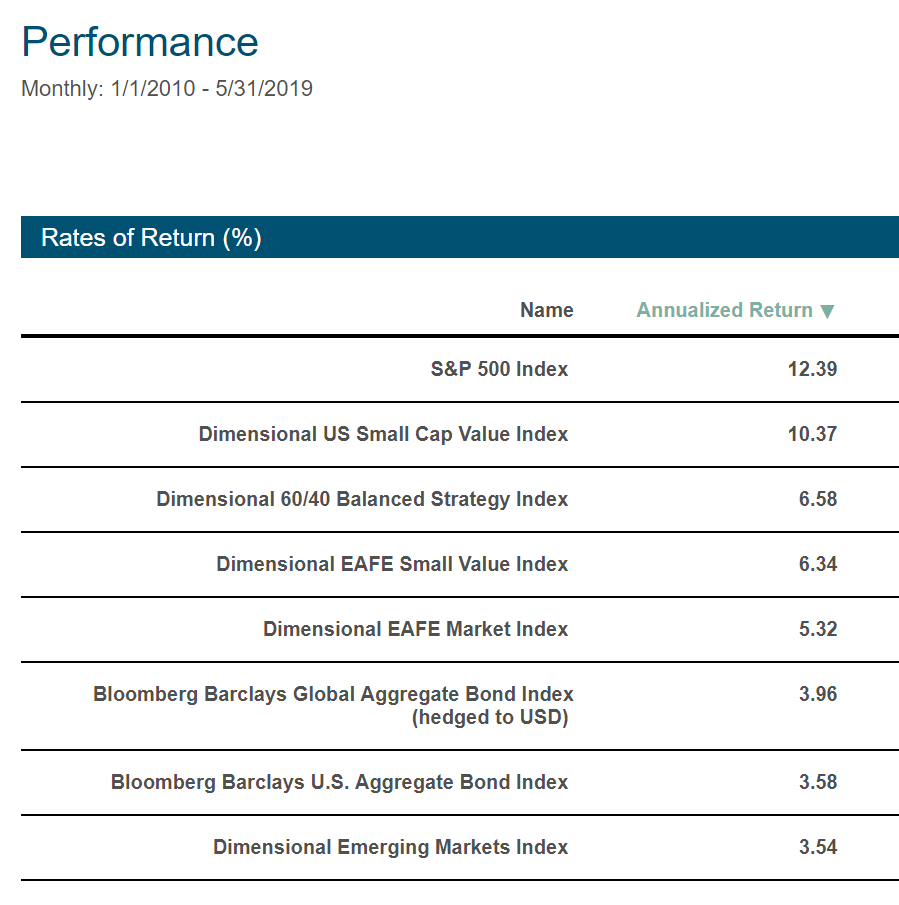
Dimensional Index data is provided by Dimensional Fund Advisors LP.
This has resulted in a significant amount of recency bias of late, where investors pour more and more into the US and pull out of foreign markets.
As we have said many times before, you can’t buy last year’s returns. Chasing returns – piling more and more into the asset class that has recently performed best – has cost investors far more over time than recessions have cost those that maintained discipline through them.
This next table shows what happened the decade prior. Many investors today are unable to recall what it was like to be invested from 2000 – 2010. This, of course, came on the heels of the 1990’s, which closely mirrors what has happened this past decade. During that stretch, traditional valuation metrics went out the window and people chased every hot name and IPO that hit the market.
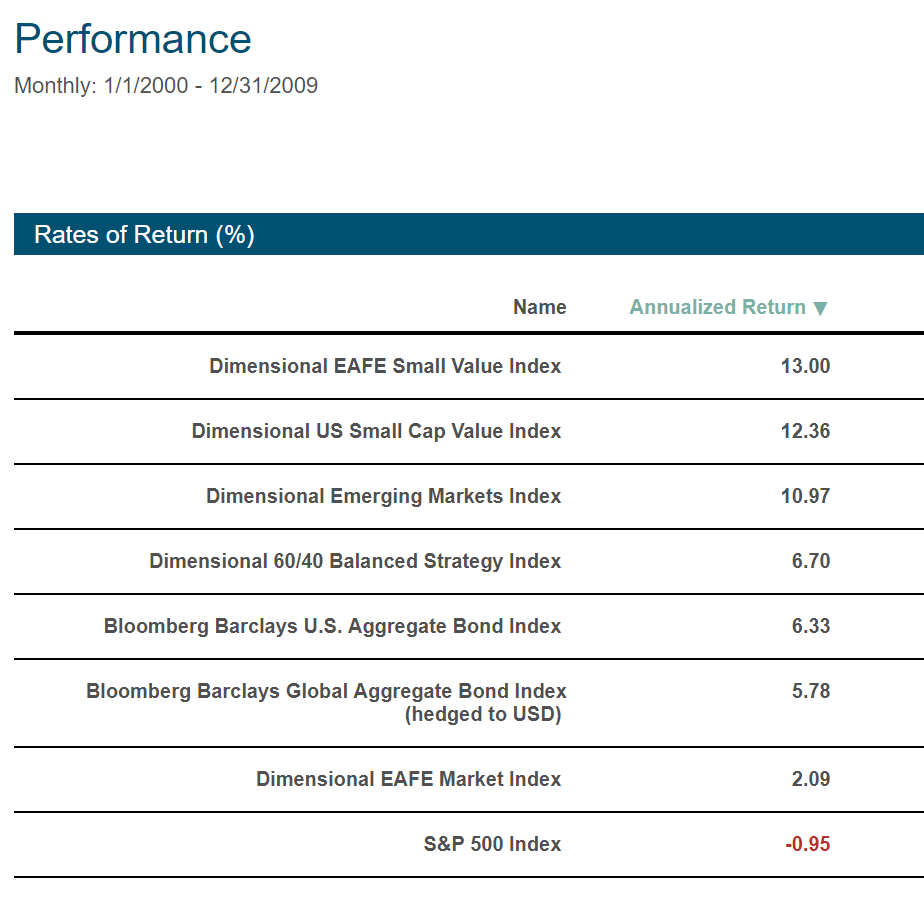
Dimensional Index data is provided by Dimensional Fund Advisors LP.
Mark Twain said “history does not repeat itself, but it often rhymes.” We have no idea if the next decade will mirror what happened on the heels of the 1990’s, but history suggests that maintaining diversification and discipline makes a great deal of sense.
The final table brings both of the last two decades together. This one has seemed to surprise a large number of clients of late. On the heels of such tremendous S&P 500 performance the last 10 years, the performance since the turn of the century has just slightly outperformed that of the broad bond market indexes, and has lagged the more balanced Dimensional Funds 60% stock, 40% bond index over that 20-year stretch.
Dimensional Index data is provided by Dimensional Fund Advisors LP.
We have written a fair amount in recent years that returns often come in bunches. Much of the time, they just bounce around randomly in both directions. There have certainly been a lot of ups and downs recently, and as a result, global markets have largely gone sideways for about a year and a half. More importantly, that’s ok! Markets have never offered anything in the way of true consistency yet continue to march their way to new heights over time.
As the trade issues continue to drag on, our sentiment is the same as it was a year ago. While we hope that the US and China can reach an agreement in the near-term, there is no certain way of knowing if or when that may occur, and what the result of an agreement will be. Some are predicting a deal by the end of the year, while others are suggesting China will continue to stall until after the presidential election next fall.
One thing that is proving to be true, however, is that there are no winners during trade wars. Both sides (and even those not directly involved) suffer and struggle.
We can see clear evidence of this in the current economic environment, where central banks around the globe (not just the US) are aggressively cutting rates to rock bottom levels in an effort to keep money flowing.
We measure the size and growth of our economy (GDP) through spending. Naturally, companies are currently reluctant to deploy capital, having no real way to project whether their costs will be 10% – 25% more or less due to tariffs. Lower interest rates are intended to make borrowing (and therefore spending) more attractive to speed up the velocity of money moving around in the system.
How long this will drag on is anyone’s guess. However, what is known about the trade war is already priced into the market. And we do think an inevitable trade deal will be good for companies around the globe, and therefore, global markets as well. While it feels like a long stretch of minimal movement, it is a relatively short blip in your investing time horizon, and completely normal in the grand scheme of how markets work.