


The Disconnect Between Markets and the Economy
On the heels of global markets rebounding sharply in the month of April, there is a growing sentiment in the financial media that markets are not accurately reflecting the reality we are all living through.
As COVID-19 continues to spread and alter our way of life, both the human and economic toll continues to mount. With concerns about possible second and third waves in the future as we re-open states and cities, there are growing references to the Spanish flu and Great Depression.
As more gets written about the disconnect between Wall Street and Main Street, and the markets and the economy, let’s try to remember that Wall Street and Main Street have always been disconnected, and for many reasons, never will be connected.
And just the same, as we have written many times before, the market is not the economy. They are separate but interrelated things. And for reasons we will outline below, really aren’t that distorted from reality at all, even though it may feel like it.
Let’s begin with where we sit today. If we simply start to break down components of the S&P 500, we find that:
- Cruise lines are down about 70%
- Department stores are down 60% – 70%
- Movie theaters and entertainment are down 50%+
- Airlines are down about 50% – 60%
- Banks are down about 35% – 40%
- Amazon, Netflix, Clorox, Domino’s, Gilead (remdesivir) – all positive
In summary, luxury items, mall stores, movie theaters, airlines, and the companies that hold their debt are all substantially negative.
Online shopping, streaming services, cleaning products, food delivery and pharmaceuticals have performed much better.
Through that lens, the market seems to be doing reasonably well at sorting out the current situation given what is currently known about the pandemic and its toll on the economy.
But we should also remember that the S&P 500 is not “the market.” It is basically just the largest 505 companies in the US. The rest of the world has not rebounded to the extent the US has, which is a reflection of having nowhere near the unprecedented stimulus and central bank support of the USA (yet). And further, smaller companies have not either, which is the reflection of a consolidation of buying into the largest companies. Make no mistake, there is still a lot of pain reflected in current prices.
Remember, markets are always forward-looking. From the moment states and cities began to lock down, markets immediately began to price in the worst-case scenario. That is ultimately why they fell 35% – 40% in a matter of days. Once the Fed and Congress whipped out the proverbial firehose, they immediately reversed course and shot back upward.
Over the last 5-6 weeks, it goes without saying that the economic data we are seeing, earnings and revenue being reported, unemployment numbers, etc., are absolutely horrible. People continue to get sick and die from the virus (although that has been slowing), and there is no guarantee of a vaccine any time in the immediate future…maybe ever. Yet the markets continue to work their way back upward from those March lows. How is this possible?
As we wrote back in March, during market crashes, they often crash too far, and they inevitably start to recover well before the economy.
The market knows the data and information coming in the weeks and months ahead is going to be awful, but that is already old news to markets, and a lot has changed since things first went into lockdown. This is precisely why the market can jump 2% – 3% on a day when record unemployment claims are announced.
As much as it does not feel right, this is not a function of the market being tone deaf. It is simply a reflection of the fact that they have already discounted prices related to that announcement well before it happened. If it were that easy to simply trade on a formal report of the data, it would have been the easiest trade on Earth to short the market each of the last 6 Wednesday afternoons in advance of the weekly Thursday morning unemployment claims. Everyone knew these numbers were coming. However, had you done that, you would have gotten decimated.
A decade ago, The Great Recession “ended” in June 2009. However, markets bottomed before that in March 2009. Further, unemployment did not peak until October at roughly 10%, and bank failures did not peak until well into 2010. State and local governments were still cutting jobs into 2013. This is why investing on economic news and data was so costly to investors that sold and sat out in the early part of this decade.
The market “value” of any given company is simply the share price times the number of shares outstanding. The total value of the stock market, then, is the sum total of all the company values.
By that standard, a 35% – 40% decline in US markets alone reflect a roughly $15 trillion decline in overall valuation. Comparatively speaking, the entire US economy (GDP) in 2019 was $21.4 trillion. Any question of whether markets appropriately priced-in the situation has to begin there.
In another oversimplification of market pricing, the S&P 500 has historically traded at a multiple of about 16x earnings (ie. 16 years of earnings). If corporate earnings are terrible for 1 year, or 2 years, even into a 3rd year (out of 16), how big of a pricing impact should that really have? Perhaps the market is simply saying that a couple bad years shouldn’t amount to a 40% drop in value.
Clearly, markets believed the impact to be more severe with the negative sectors listed above, and less severe with the more positive outcomes.
If we take a more granular approach, the company-specific example I have been using with a lot of you is Disney. I am using them because in general, it is familiar to everyone, and relatively easy to understand in terms of what it does and where it derives revenue.
Obviously, Disney relies heavily on their amusement parks, hotels, cruises and movie production. The recent addition of Disney+ as a streaming option was quite fortuitous in its timing to help offset some of the damage caused by having to close all amusement operations and movie theaters being closed. Nonetheless, it is estimated that Disney will lose somewhere in the range of $6 – $8 billion while shut-down for several months and operating at limited capacity thereafter.
The overall value of Disney Corp fell by over $100 billion in March. Make no mistake, a $6 – $8 billion loss is enormous, but even if this situation drags well into 2021, does that really translate to slashing the value by $100 billion? This is where markets start to say, “hey, maybe we overshot a bit here,” and the price subsequently bounces back part of the way to reflect something closer to reality.
Another major reason for the bounce back is a direct result of the Federal government stimulus and programs announced by the Federal Reserve.
Analyst estimates for annualized GDP contraction in Q2 (the one we are in now) are around 30% for the quarter (some are as high as 40%), with GDP gradually rising again (but not fully recovering) in Q3 and Q4. It is a virtual lock that this is going to be announced as the deepest decline on record, but that announcement won’t come until July.
On one hand, the market already knows this. And on another hand, you can’t (and don’t) invest in the GDP.
Apply the quick math, if the 30% contraction lasted the entire year, that translates to a reduction in GDP of $6.42 trillion. The combined stimulus and Fed action thus far is somewhere in the range of $6 – $6.5 trillion, and the House passed a bill last night to add another $3 trillion to that tally.
I do not believe that to be merely a coincidence.
The Federal government and Federal Reserve have been clearly signaling they are going to do everything in their power to make sure households and businesses can survive this crisis. The extent of this can not be understated.
These numbers are so massive, that in Q2 and Q3, the average US household is projected to have MORE disposable income than in the first quarter of this year. Eventually that money gets spent, and the market knows that.
As one prominent hedge fund manager recently stated, “you are replacing about $3.7 trillion of lost economic output with $12.7 trillion coming from the Federal government. I like my chances in that market.”
Yes, there have been hiccups and mistakes in deploying the dollars themselves, but there has never been such a large scale program rolled out this quickly, so expecting perfection is a recipe for disappointment.
In looking back at prior crises, you may recall the phrase “quantitative easing” that arose on the heels of the 2008 – 2009 crisis. Without getting into the details of what it means, it refers to Federal Reserve actions intended to increase liquidity in financial markets.
Referring to the chart below, you can see that the US central bank engaged in a series of “QE” measures over the course of 6 years to ensure that markets would operate smoothly and banks would have the ability to lend to companies and people in need. They are going to eclipse the entirety of those past measures this quarter alone.
Referring to the chart below, you can see that the US central bank engaged in a series of “QE” measures over the course of 6 years to ensure that markets would operate smoothly and banks would have the ability to lend to companies and people in need. They are going to eclipse the entirety of those past measures this quarter alone.
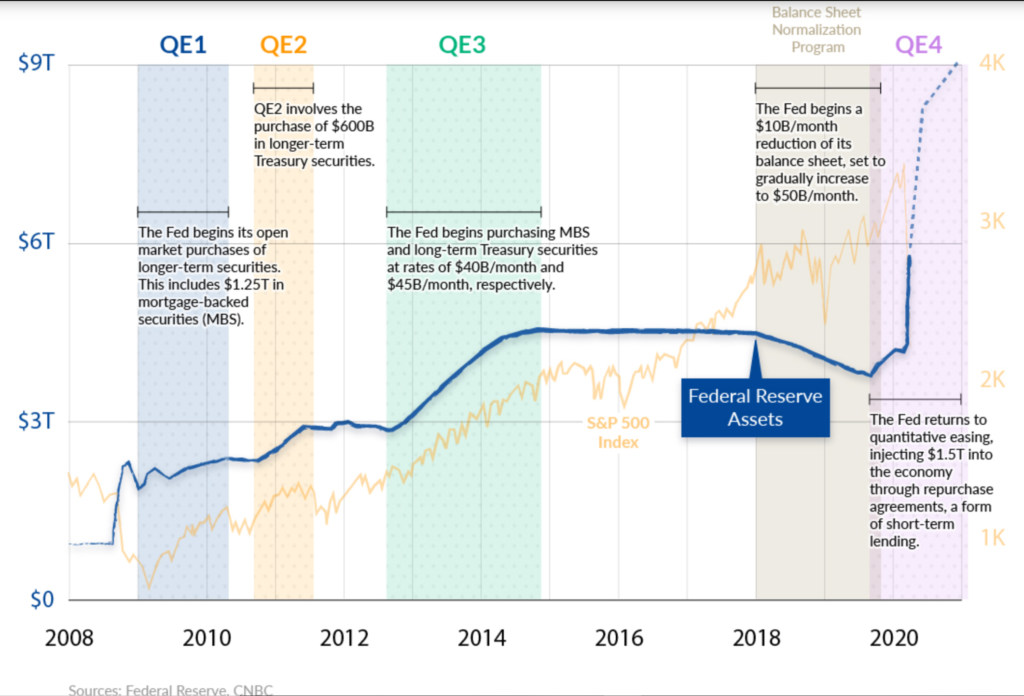
Actions of this size and scale are also what make this crisis so distinct from any comparisons to the Great Depression. Back then, Congress went completely the opposite direction by cutting spending and raising taxes. In addition, FDIC insurance did not exist, which led to the run on the banks.
By definition, raising taxes reduces the amount of money in the economy. Similarly, cutting spending reduces the amount of money in the economy. And when people pull their cash from banks, that leaves less reserves to lend against, which cuts off a major supply of credit for people and businesses.
The actions of the past two months are a reflection of learning from past crises, and identifying what worked and what was a mistake.
This is ultimately why some of the most prominent investors that have walked the Earth were calling late March a generational buying opportunity. All of them were cautious to add that markets can still retreat further in the short-term, but the lens through which they view investment opportunities is decades, not months.
Much is also being written about the decisions of Warren Buffett in Q1 to remain cautious, continue to hold cash, and his exit from airline stocks (for the third time, after swearing them off about 2 decades ago). As much as people want to cite his famed phrase to be greedy when others are fearful, Buffett has always exercised caution, and while he isn’t afraid to pounce when opportunities arise, his opportunity set and timeline are different than the average investor.
For context, Berkshire has around $135 billion in cash on hand. That is more than the entire value of companies like McDonald’s, Costco, Nike or Medtronic, which hover right around #40 for the largest companies in the S&P 500.
Further complicating matters, once he owns more than 10% of a company, he is subject to very different trading and reporting requirements. Even if he were to believe that Costco was a screaming buy in the last week of March, (a) he would be limited to “only” spending about $13 billion of that cash, and (b) buying 10% of the shares of a company is not something you can do in a day. A purchase of that magnitude may take months to execute at the price you want to pay for it.
Buffett is often looking to buy entire companies, and that takes time. He referenced that phone calls were coming in early March, but as soon as the Fed intervened, those dried-up. This time around, the Federal Reserve stepped into the role Berkshire Hathaway played in 2008 – 2009. It is possible that his day will still come, and the opportunities he is looking for will arise as this situation plays out in the months ahead.
He did not make his name by being the most aggressive investor. He made it by being the most patient investor. His decisions are not based on the momentum of the coming weeks or months. He is always focused on years.
A long time ago, Warren Buffett’s mentor, Benjamin Graham, said that “in the short-term, the market is a voting machine. In the long-run, it is a weighing machine.”
Early March was an example of the voting machine. What has happened since is the weighing process. The market knows, it absolutely knows, that the upcoming economic news, earnings reports, GDP readings, etc., are all going to be terrible. But the market is trying to price in years and decades, not months or weeks.
We hope that helps provide a lens for why this may not be completely crazy. And of course, should the re-opening of states and cities go poorly, or if the virus comes back with a greater vengeance in the fall and winter, the markets will recalibrate again.
So where do things go from here? As we all know by now, there is no playbook for this. The smartest people in the world can’t agree on how or when the world will emerge from this crisis and what the aftermath will look like.
As was referenced prior, there has been a mass consolidation of the US market into a relatively small number of really big companies. Big sounds like better and safer right now, so this behavior is no surprise. But the last time so few companies comprised such a large portion of the market was the very late 1990’s.
As a by-product of that, there has been a tremendous breakdown in valuation between the most expensively priced companies and the cheapest, the likes of which we have also not seen since the year 2000. In times like this, the worst thing investors can do is chase recent performance.
On the heels of 9 of the last 10 bear markets, smaller companies have outperformed during the recovery phase.
It is said that valuation is the closest thing we have to gravity in markets. Undervalued companies will eventually revert upward to their mean, and overvalued companies will do the opposite.
Here are two graphs that highlight the momentum of the largest companies relative to smaller, undervalued companies. The first shows the performance of both from the 5-year period covering 1995 through the end of 1999. The second is the same comparison of 2015 – 2019.
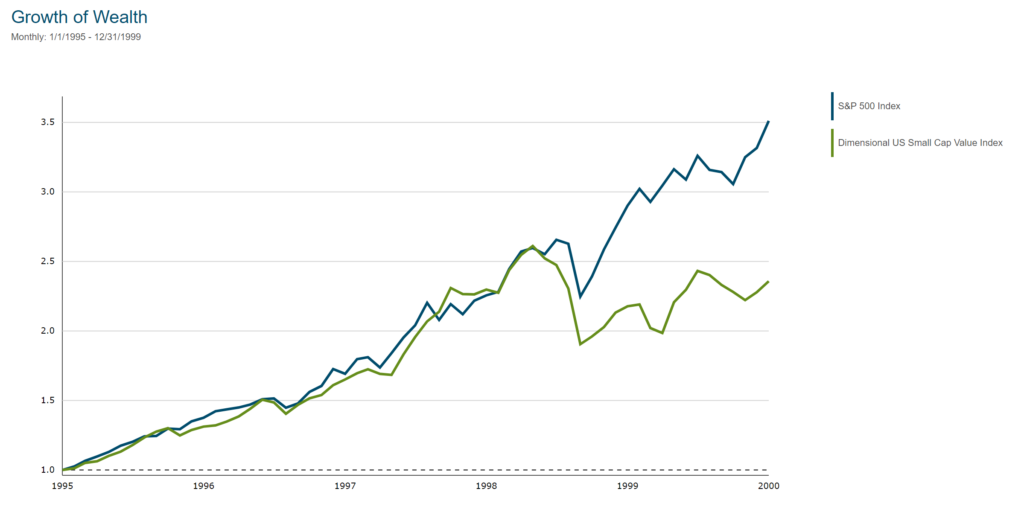
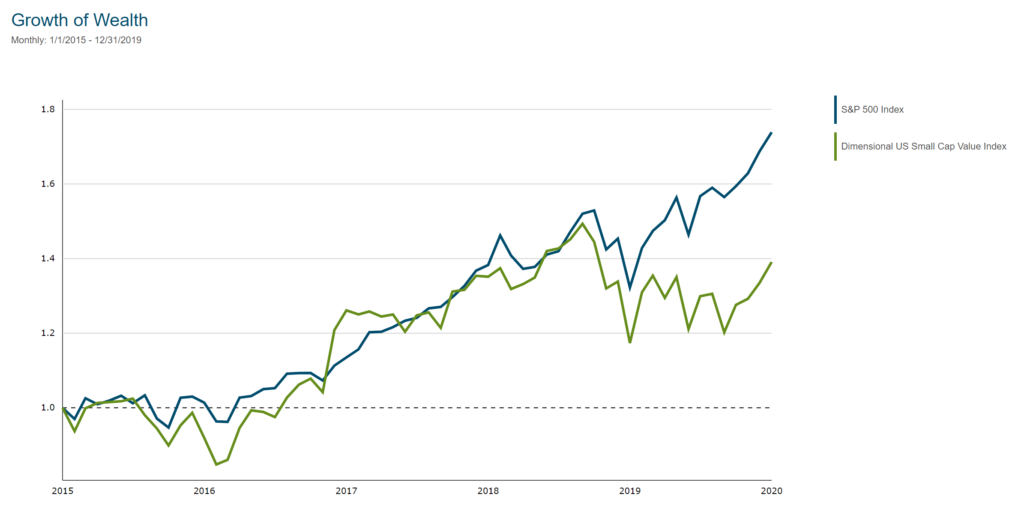
You can basically swap the lines on either graph and it shows the same result. In other words, we have seen this happen before. And while this time is different in terms of the situation at hand, the behavioral elements of it are the same.
What seems safe now rarely is. For example, Clorox has been a darling in the market through the crisis for obvious reasons…they sell wipes, hand sanitizer and other disinfectants. Sales have gone through the roof.
What has to be assessed moving forward is to what extent sales will continue as the world emerges from Covid, and/or for how long. People are not going to stop using these products, but they probably won’t be hoarding them to the same extent forever.
I have no predictions about the price of Clorox stock. It is a great and well-run company. But this example is simply to point out that “safety” in this case is relative. The company is probably not going away, but if you buy at a premium, an extremely solid, safe company can turn into a poor investment.
Here is a chart of the 5-year stretch that followed the last time this occurred.
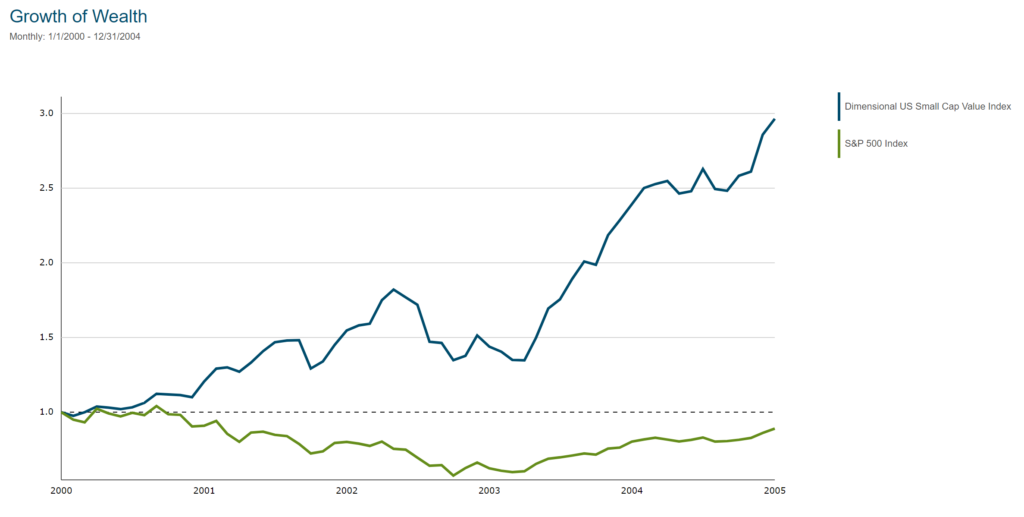
And here is the data (with expanded indexes) in numeric form for that same 5-year stretch:
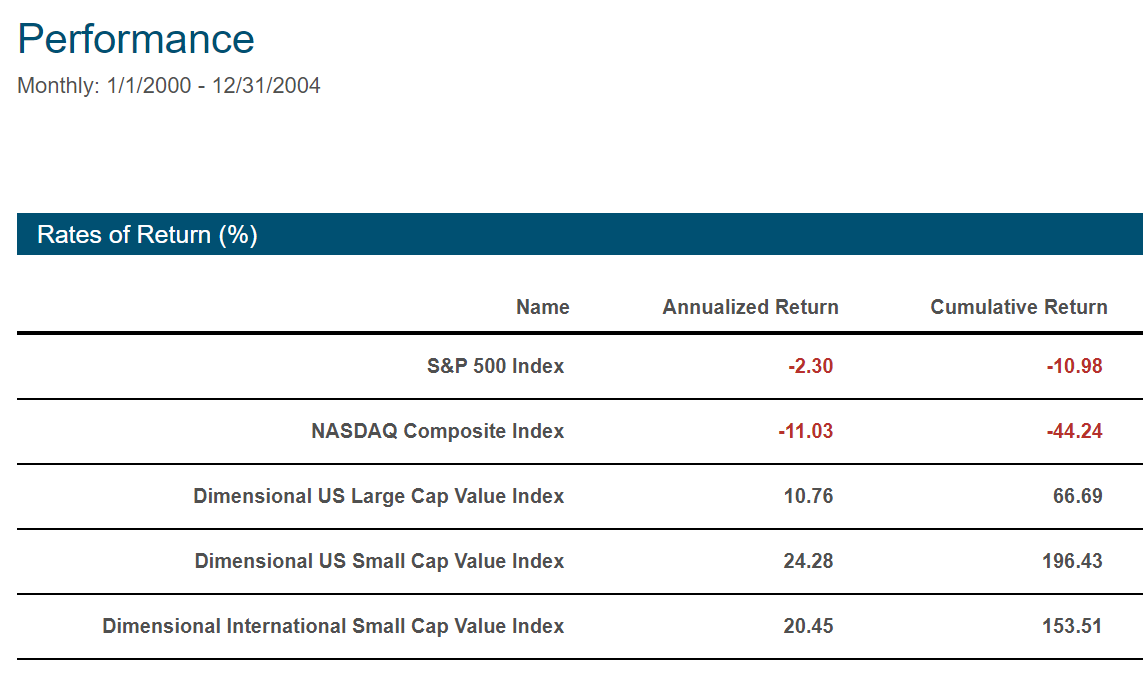
As Mark Twain said, “history doesn’t repeat itself, but it often rhymes.” Of course, there is no guarantee of it, but the current data set and valuation metrics are eerily similar to what we saw back then.
These are basic charts that make it easier to visualize the concepts, but if you want an exhaustive dive into the data and research being performed by several of the more prominent research teams in the industry, you can access summaries and white papers here, here, here and here.
In short, the most expensive stocks are now 12x more expensive than the cheapest. That is not sustainable. There is still an incredible amount of recovery and upside out there, but answering the question of “when?” is more up to the invisible monster.
We have the most brilliant minds on the planet working to try to “solve” this pandemic. Whether the path to recovery becomes clear as the result of a vaccine, new research proves a lesser impact / effect than we thought, new treatments arrive that can accelerate the recovery or reduce the symptoms, or we just have to accept that we will have to learn to live with this thing, companies and markets will evolve and change accordingly.
Sir John Templeton explained, “Bull markets are born on pessimism, grow on skepticism, mature on optimism and die on euphoria.”
It is hard to believe that the escalation of this into a full-blown crisis has really only been going on for two months. It feels much longer. But that also points to how rapidly everything “known” is changing. We are still in the early innings of this, and we are going to learn even more over the next two months.
The science and technology behind those working on the virus is far better and faster than any pandemic of the past. It is certainly reasonable to be pessimistic and skeptical given what we are dealing with, but that sentiment is extremely pervasive, both in our day to day lives, as well as the markets.
Be smart and stay safe as we begin to re-open our economies in the weeks ahead.